
Bitcoin ($BTCUSD) is riding a wave of surging optimism, smashing past $112k as retail and institutional capital pour into the cryptocurrency. Some say the market has grown euphoric, and that a sharp pullback may be lurking around the corner. Others believe this is just the beginning of another leg higher. A few key questions to guide your analysis: What does ...
Join Dave as he reviews three common candle patterns traders can use to identify potential turning points. From bullish engulfing patterns to evening star patterns, Dave gives insights on how to leverage these powerful candle signals to anticipate market shifts. He also shows combining candle patterns with conventional technical analysis tools can help improve success rates. This video originally premiered ...
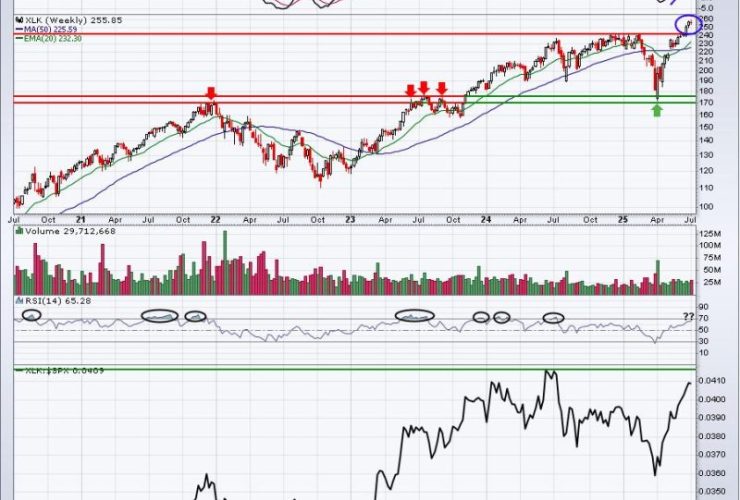
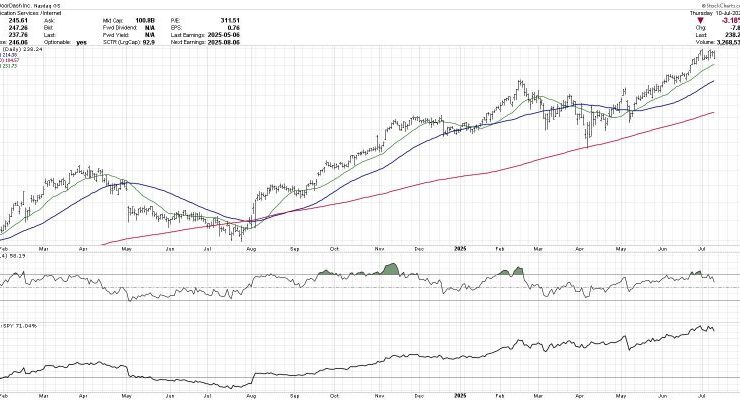
I remain very bullish and U.S. stocks have run hard to the upside off the April low with growth stocks leading the way. I expect growth stocks to remain strong throughout the summer months, as they historically do, but we need to recognize that they’ve already seen tremendous upside. Could technology (XLK) names, in particular, use a period of consolidation? ...
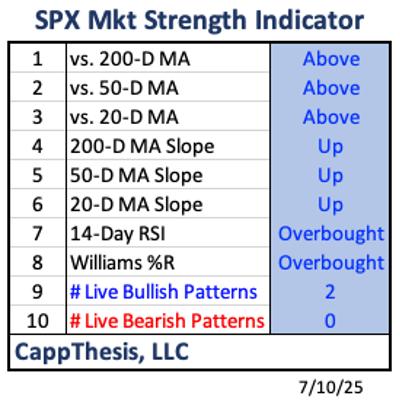
Up to this point, the S&P 500 ($SPX) has now stayed above the 6,200-mark for eight straight days. The upside follow-through has been limited, but the drawdown has also been shallow. The onus continues to be on the bears to do something with the stretched state. We discuss this in terms of the CappThesis Market Strength Indicator below. What Is ...
If you’re serious about trading or investing, establishing a weekly market routine is a must. But where do you begin? In this eye-opening video, Grayson Roze, Chief Strategist at StockCharts, shares the method he uses every week to stay aligned with the market’s biggest drivers — the top 25 stocks by market cap. Learn how to build a customized ChartList ...
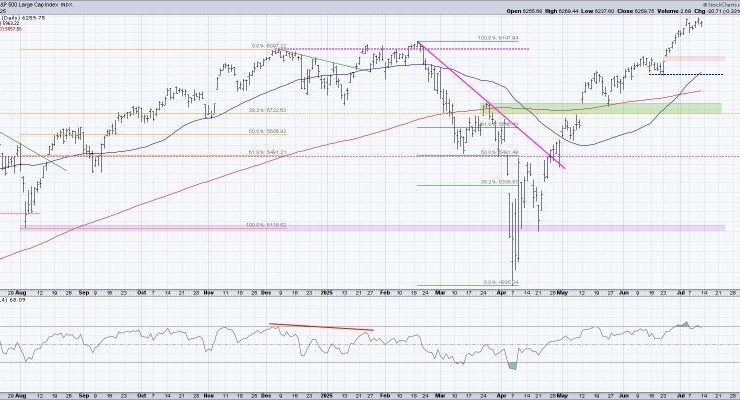
The S&P continues to push higher, with the equity benchmark almost reaching 6300 this week for the first time in history. With so many potential macro headwinds still surrounding us, how can the market continue to reflect so much optimism? On the other hand, when will bulls wake up and realize that this market is obviously overextended and rotate significantly lower? With ...
As we navigate the evolving stock market landscape, understanding key sectors and their trends is important, especially during earnings season. This week, the spotlight shines on the Financial sector, with several of the largest banks reporting. Five of the top 10 holdings within the Financial Select Sector SPDR ETF (XLF) are on deck: J.P. Morgan (JPM), Goldman Sachs (GS), Bank ...
Is the market flashing early signs of a shift? In this week’s video, Mary Ellen McGonagle breaks down the subtle but telling moves happening under the surface. From strength in semiconductors, home builders, and energy to surging momentum in Bitcoin and silver, Mary Ellen highlights the sectors gaining traction and the technical setups traders should have on their radar. She ...
Investing in triple-leveraged ETFs may not be on your radar. But that may change after you watch this video. Tom Bowley of EarningsBeats shares how he uses the 3x leveraged ETFs to take advantage of high probability upside moves. Tom shows charts of 3x leveraged ETFs that mirror their benchmark — TNA (Russell 2000), SOXL (Semiconductors), and LABU (Biotech), and ...
Over a number of years working for a large money manager with a rich history of stock picking, I became more and more enamored with the benefits of scanning for constructive price charts regardless of the broad market conditions. Earlier in my career, as I was first learning technical analysis, I devoured work by stock picking guru Mike Webster and ...