This week, Frank analyzes recent technical signals from the S&P 500, including overbought RSI levels, key price target completions, and the breakout potential of long-term bullish patterns. He examines past market breakouts and trend shifts, showing how overbought conditions historically play out. Frank also walks through a compelling mean-reversion trade idea in Apple, emphasizing its lagging performance and potential rebound ...
Joe presents a deep dive into MACD crossovers, demonstrating how to use them effectively across multiple timeframes, establish directional bias, and improve trade timing. He explains why price action should confirm indicator signals, sharing how to identify “pinch plays” and zero-line reversals for higher-quality setups. Joe then analyzes a wide range of stocks and ETFs, from QQQ and IWM to ...

Roblox Corporation (RBLX), the company behind the immersive online gaming universe, has been on a strong run since April. This isn’t the first time the stock demonstrated sustained technical strength: RBLX has maintained a StockCharts Technical Rank (SCTR) above 90, aside from a few dips, since last November. Currently, RBLX is showing up on a few scans that may signal ...

Stocks keep notching record highs. If you’re like most investors, you’re probably wondering, “Should I really chase these prices or sit tight and wait for a pullback?” Instead of overthinking and ending up in Analysis-Paralysis land, however, it may be worth exploring other avenues — and maybe even something you’ve never thought of. Enter bearish counter-trend options strategies. Yup, it ...

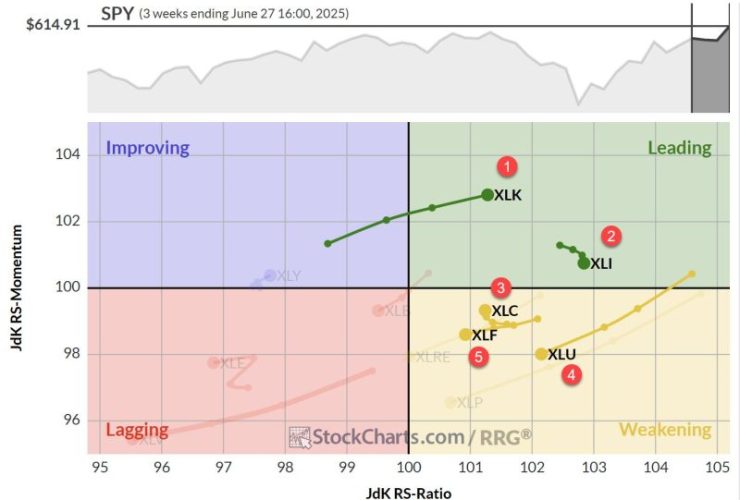
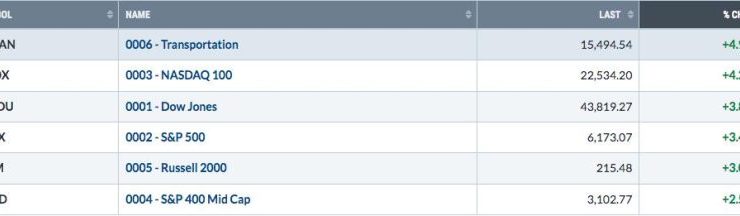
The last day of trading for the first half of 2025 ended with a bang. The S&P 500 ($SPX) and Nasdaq Composite ($COMPQ) closed at record highs — an impressive finish, given the year has seen significant swings. We saw signs of investors rotating into technology stocks last week when the Nasdaq 100 ($NDX) hit a record high. Looking at ...
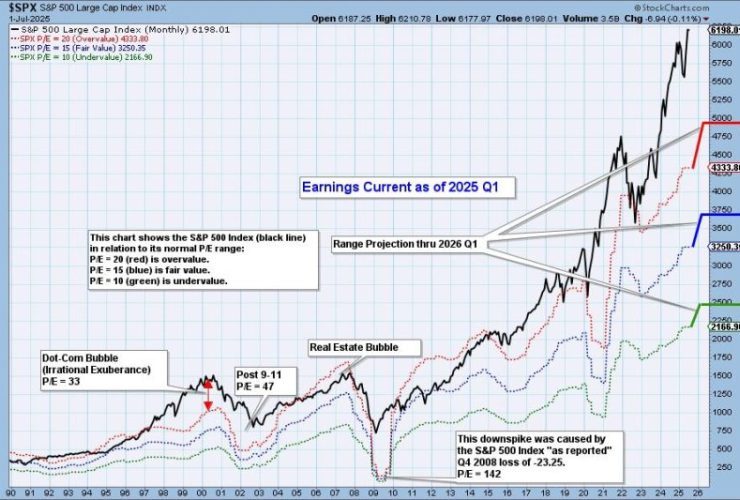
S&P 500 earnings are in for 2025 Q1, and here is our valuation analysis. The following chart shows the normal value range of the S&P 500 Index, indicating where the S&P 500 would have to be in order to have an overvalued P/E of 20 (red line), a fairly valued P/E of 15 (blue line), or an undervalued P/E of ...
Join Grayson for a solo show as he reveals his top 10 stock charts to watch this month. From breakout strategies to moving average setups, he walks through technical analysis techniques using relative strength, momentum, and trend-following indicators. As a viewer, you’ll also gain insight into key market trends and chart patterns that could directly impact your trading strategy. Whether ...
A Greek Odyssey First of all, I apologize for any potential delays or inconsistencies this week. I’m currently writing this from a hotel room in Greece, surrounded by what I can only describe as the usual Greek chaos. Our flight back home was first delayed, then canceled, then rescheduled and delayed again. So instead of being back at my desk ...
In this video, Mary Ellen spotlights key pullback opportunities and reversal setups in the wake of a strong market week, one which saw all-time highs in the S&P 500 and Nasdaq. She breaks down the semiconductor surge and explores the bullish momentum in economically-sensitive sectors, including software, regional banks, and small-caps. Watch as she highlights top stocks to add to ...
Below is the EB Weekly Market Report that I sent out earlier to our EarningsBeats.com members. This will give you an idea of the depth of our weekly report, which is a very small piece of our regular service offerings. We called both the stock market top in February and stock market bottom in April, and encouraged EB members to ...