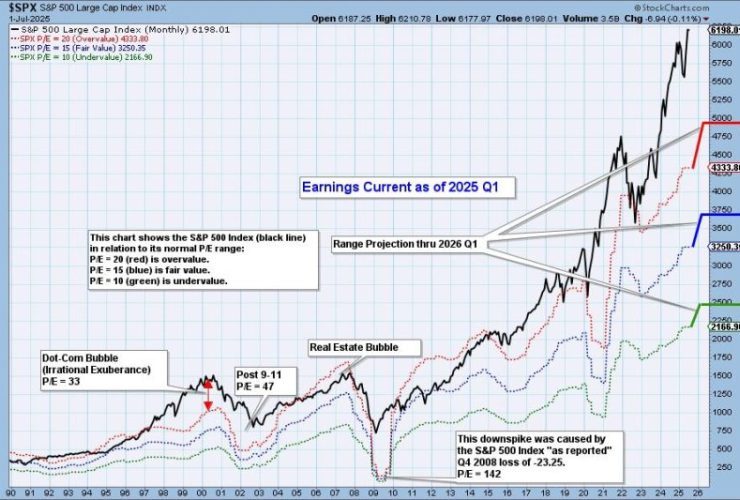
S&P 500 earnings are in for 2025 Q1, and here is our valuation analysis. The following chart shows the normal value range of the S&P 500 Index, indicating where the S&P 500 would have to be in order to have an overvalued P/E of 20 (red line), a fairly valued P/E of 15 (blue line), or an undervalued P/E of ...
Join Grayson for a solo show as he reveals his top 10 stock charts to watch this month. From breakout strategies to moving average setups, he walks through technical analysis techniques using relative strength, momentum, and trend-following indicators. As a viewer, you’ll also gain insight into key market trends and chart patterns that could directly impact your trading strategy. Whether ...
A Greek Odyssey First of all, I apologize for any potential delays or inconsistencies this week. I’m currently writing this from a hotel room in Greece, surrounded by what I can only describe as the usual Greek chaos. Our flight back home was first delayed, then canceled, then rescheduled and delayed again. So instead of being back at my desk ...

In this video, Mary Ellen spotlights key pullback opportunities and reversal setups in the wake of a strong market week, one which saw all-time highs in the S&P 500 and Nasdaq. She breaks down the semiconductor surge and explores the bullish momentum in economically-sensitive sectors, including software, regional banks, and small-caps. Watch as she highlights top stocks to add to ...
Below is the EB Weekly Market Report that I sent out earlier to our EarningsBeats.com members. This will give you an idea of the depth of our weekly report, which is a very small piece of our regular service offerings. We called both the stock market top in February and stock market bottom in April, and encouraged EB members to ...
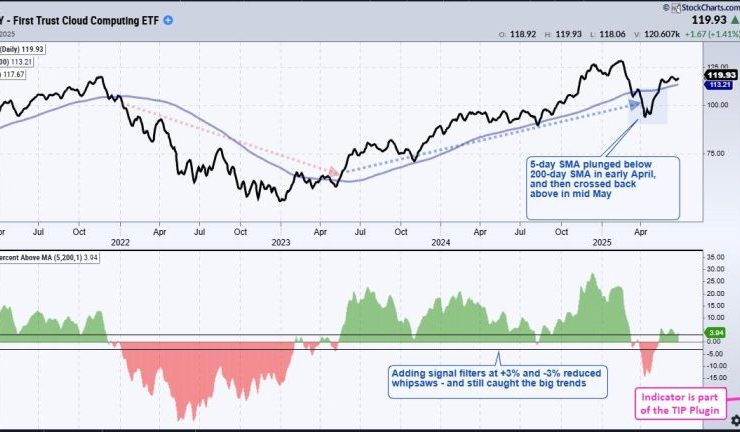
Chartists can improve their odds and increase the number of opportunities by trading short-term bullish setups within bigger uptrends. The first order of business is to identify the long-term trend using a trend-following indicator. Second, chartist can turn to more granular analysis to find short-term bullish setups. Today’s example will use the Cloud Computing ETF (SKYY). *********************** , which has ...
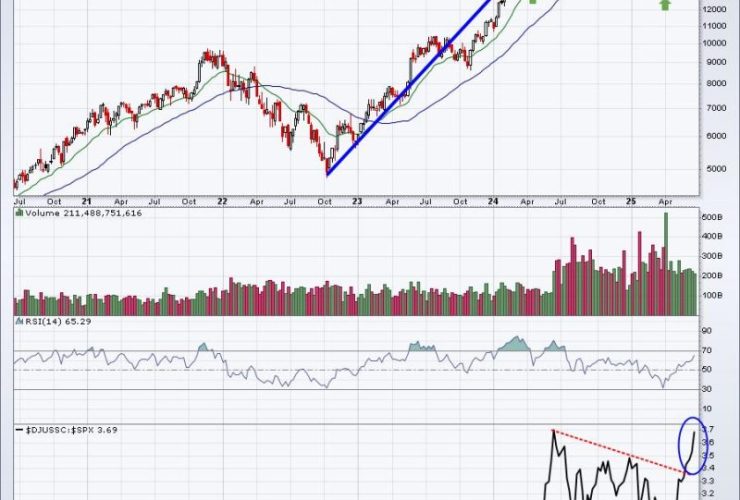
The bears are now left grasping at straws. What about tariffs? What about inflation? What about recession? What about the Fed? What about interest rates? What about the Middle East? What about the deficits? Blah, blah, blah. When it comes to the media, you need to bury your head in the sand. Actually, take your head out of the sand ...
If you’ve looked at enough charts over time, you start to recognize classic patterns that often appear. From head-and-shoulders tops to cup-and-handle patterns, they almost jump off the page when you bring up the chart. I would definitely include Fibonacci Retracements on that list, because before I ever bring up the Fibonacci tool on StockCharts, I’m pretty confident the levels are ...

As we head into the second half of 2025, here are three stocks that present strong technical setups with favorable risk/reward profiles. One is the largest market cap stock we’re familiar with, which bodes well for the market in general. The second is an old tech giant that’s making a comeback. The third is a beaten-down S&P 500 name that ...
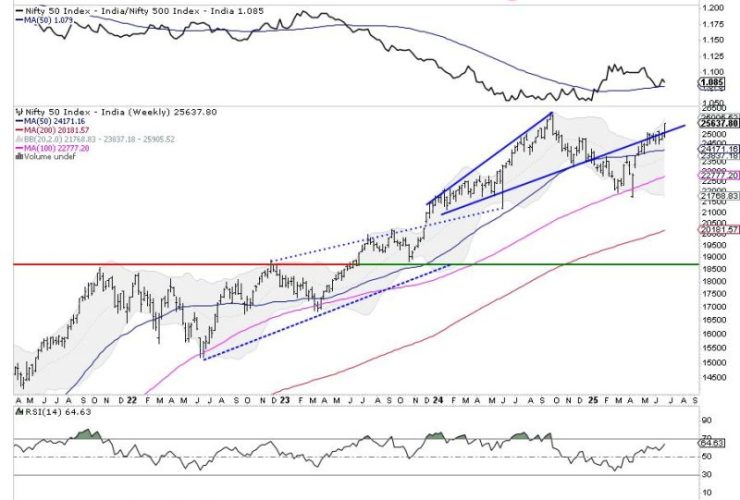
After six weeks of consolidation and trading in a defined range, the markets finally broke out from this formation and ended the week with gains. Over the past five sessions, the markets have largely traded with a positive undercurrent, continuing to edge higher. The trading range was wider than anticipated; the Nifty traded in an 829-point range over the past ...