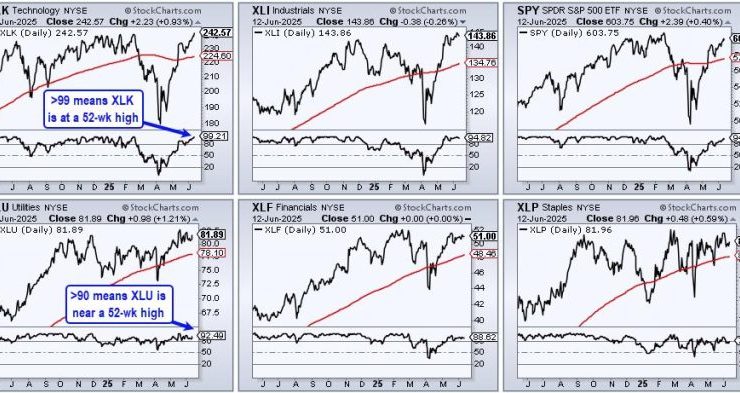
Three sectors stand out, with one sporting a recent breakout that argues for higher prices. Today’s report will highlight three criteria to define a leading uptrend. First, price should be above the rising 200-day SMA. Second, the price-relative should be above its rising 200-day SMA. And finally, leaders should trade at or near 52-week highs. Let’s compare the Utilities SPDR ...

Catching a sector early as it rotates out of a slump is one of the more reliable ways to get ahead of an emerging trend. You just have to make sure the rotation has enough strength to follow through. On Thursday morning, as the markets maintained a cautiously bullish tone, I checked the New Highs panel on the StockCharts Dashboard, ...
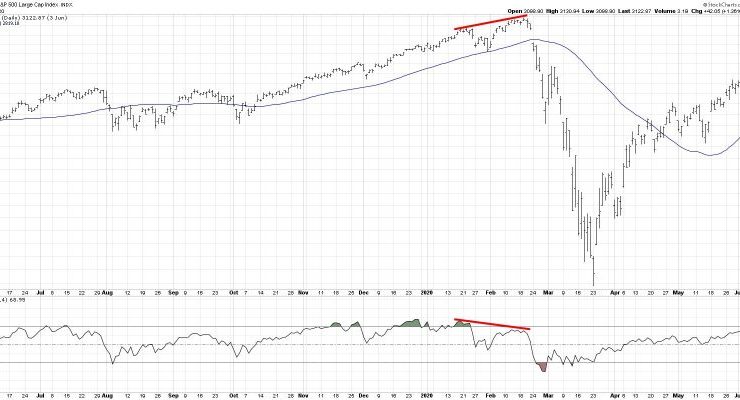
With Friday’s pullback after a relatively strong week, the S&P 500 chart appears to be flashing a rare but powerful signal that is quite common at major market tops. The signal in question is a bearish momentum divergence, formed by a pattern of higher highs in price combined with lower peaks in momentum, which indicates weakening buying power after an extended ...

While the S&P 500 ($SPX) logged a negative reversal on Wednesday, the Cboe Volatility Index ($VIX), Wall Street’s fear gauge, logged a positive reversal. This is pretty typical: when the S&P 500 falls, the VIX rises. Here’s what makes it interesting: the VIX has quietly crept up in three of the last four days. Before the midday pivot, the VIX ...

This week, Julius shows how the Technology sector is edging toward leadership, alongside Industrials and soon-to-follow Communication Services. He highlights breakout lines for SPY, XLK, and XLC, noting that conviction climbs when daily and weekly RRG tails align to point northeast together. Bitcoin is sprinting into the leading quadrant next to a reinvigorated SPY, while bonds, commodities, and a weakening ...

Joe kicks off this week’s video with a multi‑timeframe deep dive into the 10‑year U.S. Treasury yield (TNX), explaining why a sideways coil just below the 5% level could be “downright scary” for equities. From there, he demonstrates precise entry/exit timingwith a combination of ADX, MACD, and RSI. Joe also covers the short-term divergence developing in the QQQ, takes a ...

Micron Technology, Inc. (MU) appears poised for an explosive breakout, both technically and fundamentally. While it remains to be seen whether this materializes by its Q3 earnings report on June 25, the setup suggests a high-probability move is about to happen, and soon. The fundamental case for a breakout is backed by MU’s deep involvement in the AI memory boom. ...

Unlock the power of divergence analysis! Join Dave as he breaks down what a bearish momentum divergence is and why it matters. Throughout this video, Dave illustrates how to confirm (or invalidate) the signal on the S&P500, Nasdaq100, equal‑weighted indexes, semiconductors, and even defensive names like AT&T (T). This video originally premiered on June 10, 2025. Watch on StockCharts’ dedicated David Keller page! ...

The U.S. stock market has been painting a subtle picture recently. While the broader indexes, such as the S&P 500 ($SPX), Nasdaq Composite ($COMPQ), and Dow Jones Industrial Average ($INDU), are indeed grinding higher, the daily movements have been relatively subdued. This is a noticeable shift from the more dynamic action we observed in April. Investors may be waiting for ...
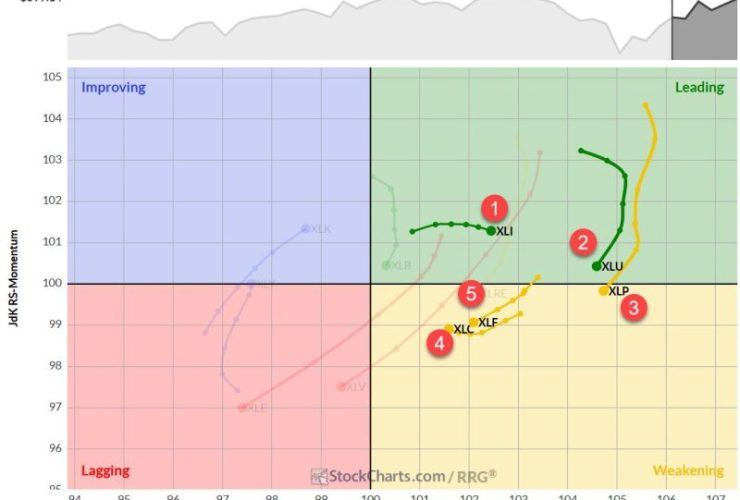
Sector Rotation: A Week of Stability Amidst Market Dynamics Last week presented an intriguing scenario in our sector rotation portfolio. For the first time in recent memory, we witnessed complete stability across all sector positions — no changes whatsoever in the rankings. (1) Industrials – (XLI) (2) Utilities – (XLU) (3) Consumer Staples – (XLP) (4) Communication Services – (XLC) ...