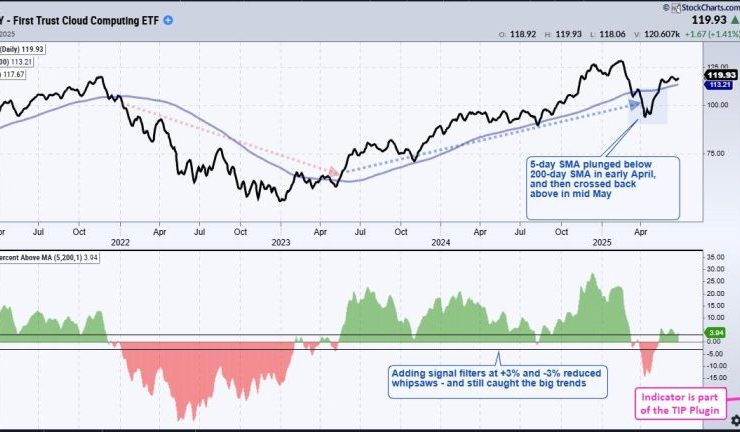
Chartists can improve their odds and increase the number of opportunities by trading short-term bullish setups within bigger uptrends. The first order of business is to identify the long-term trend using a trend-following indicator. Second, chartist can turn to more granular analysis to find short-term bullish setups. Today’s example will use the Cloud Computing ETF (SKYY). *********************** , which has ...
The bears are now left grasping at straws. What about tariffs? What about inflation? What about recession? What about the Fed? What about interest rates? What about the Middle East? What about the deficits? Blah, blah, blah. When it comes to the media, you need to bury your head in the sand. Actually, take your head out of the sand ...
If you’ve looked at enough charts over time, you start to recognize classic patterns that often appear. From head-and-shoulders tops to cup-and-handle patterns, they almost jump off the page when you bring up the chart. I would definitely include Fibonacci Retracements on that list, because before I ever bring up the Fibonacci tool on StockCharts, I’m pretty confident the levels are ...

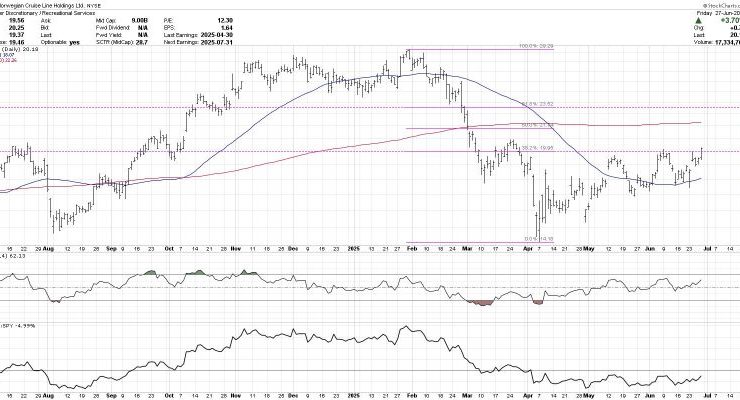
As we head into the second half of 2025, here are three stocks that present strong technical setups with favorable risk/reward profiles. One is the largest market cap stock we’re familiar with, which bodes well for the market in general. The second is an old tech giant that’s making a comeback. The third is a beaten-down S&P 500 name that ...
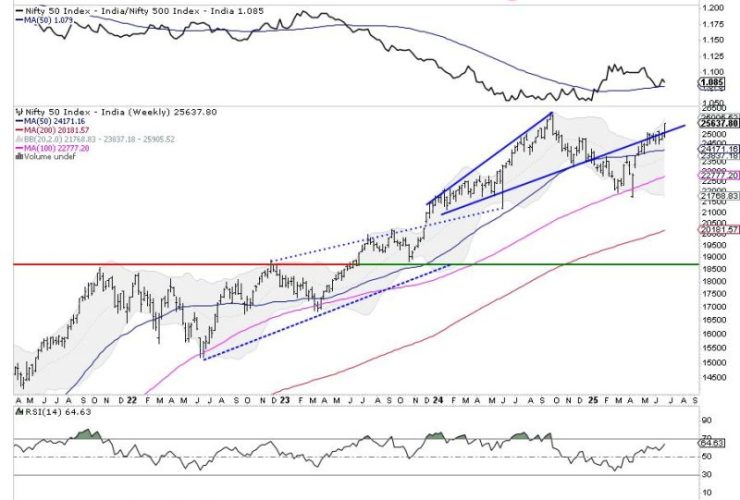
After six weeks of consolidation and trading in a defined range, the markets finally broke out from this formation and ended the week with gains. Over the past five sessions, the markets have largely traded with a positive undercurrent, continuing to edge higher. The trading range was wider than anticipated; the Nifty traded in an 829-point range over the past ...

The S&P 500 ($SPX) just logged its second consecutive 1% gain on Tuesday. That’s three solid 1% advances so far in June. And with a few trading days remaining in the month, the index has recorded only one 1% decline so far. A lot can still happen before the month ends, but, as it stands, June is looking a lot ...

MACD, ADX and S&P 500 action frame Joe Rabil’s latest show, where a drifting index push him toward single-stock breakouts. Joe spotlights the daily and weekly charts of American Express, Fortinet, Parker-Hannifin, Pentair, and ServiceNow as showing strong ADX/MACD characteristics. He outlines how the patterns showing on these charts can outshine the broad market until momentum confirms a larger move. ...

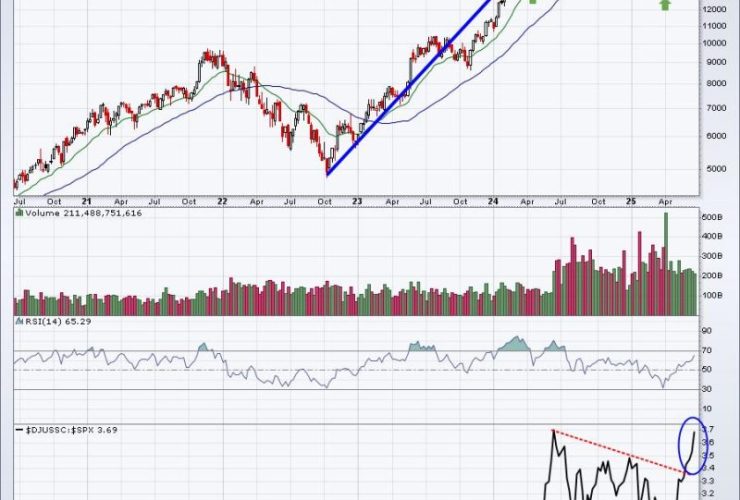
Over a month ago, Super Micro Computer, Inc. (SMCI) appeared on our StockCharts Technical Rank (SCTR) Top 10 list. SCTRs are an exclusive StockCharts tool that can help you quickly find stocks showing strong technical strength relative to other stocks in a similar category. Now, the stock market is dynamic, and SMCI, like many stocks, went through a consolidation period ...
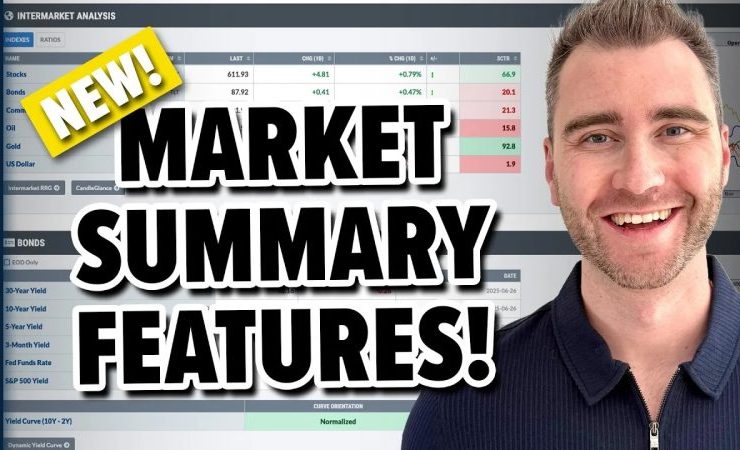
Take a tour of the FIVE latest updates and additions to our fan-favorite, professionally-curated Market Summary dashboard with Grayson! In this video, Grayson walks viewers through the new charts and indexes that have been added to multiple panels on the page. These include mini-charts for the S&P sectors, a new index-only put/call ratio, intermarket analysis ratios to compare performance across ...
Think trading against the trend is risky? You may want to reconsider. When a stock or ETF is trending lower, the smart money watches for signs of a reversal; those early signals can get you into a trend before everyone else and lead to favorable risk-to-reward ratios. In this video, options strategist Tony Zhang breaks down how to spot high-probability ...