Where are we in the market cycle? In this video, Julius reviews the sector rotation and asset class performance from the past 2-3 weeks to provide an objective take on where we stand in the current market cycle. Using his signature Relative Rotation Graphs (RRG), he uncovers shifts in momentum and leadership across sectors and asset classes. This video was ...
Want to know how to find strong stocks in a volatile market? In this video, Joe uses Relative Strength (RS), Fibonacci retracements, and technical analysis to spot top sectors and manage downside risk. Follow along as Joe breaks down how to use the Relative Strength indicator to separate outperforming stocks from those failing at resistance. He highlights sectors showing strong ...

The S&P 500 ($SPX) just staged one of the sharpest rebounds we’ve seen in years. After tumbling into deeply oversold territory earlier this year, the index has completely flipped the script—short-term, medium-term, and even long-term indicators are now pointing in a new direction. One longer-term indicator that hit an extreme low in early April was the 14-week relative strength index ...

Let’s be real. How many of you kicked yourselves for not jumping into some long positions last Friday? Of course, hindsight is 20/20, and unless you’ve got a crystal ball, there’s no sure way to know what the market will do next. What you can do, though, is be ready for the next opportunity, and one stock that’s flashing signals ...
Bullish signal alert! Over 50% of S&P 500 stocks are now above their 200-day moving average. In this video, Dave explains this key market breadth indicator and what it means for stock market trends. He shows how moving average breadth has reached a bullish milestone, what this means based on historical signals over the past 15 years, and how it ...
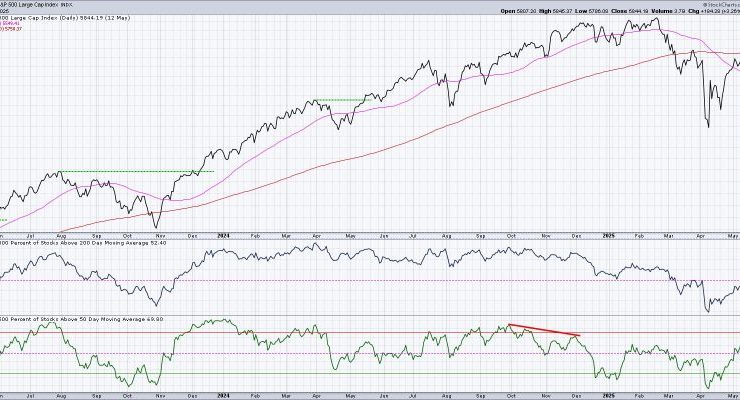
We’ve been cautious about the uptrend phase off the April low for a number of reasons, including the lack of breadth support. While short-term measures of breadth had turned more positive, the long-term breadth conditions had remained firmly in the bearish realm. With the renewed strength in risk assets over the last week, our long-term breadth measures now indicate a ...

For months, investors have been on edge over U.S.-China tariff tensions, bracing for everything from fears of empty shelves to rising prices. But after this weekend’s trade talks, where both sides agreed to temporary tariff cuts (emphasis on temporary), stocks surged. On Monday, the Dow Jones Industrial Average ($INDU) jumped 1,160 points, while the S&P 500 ($SPX) and Nasdaq Composite ...
Earnings season continues, and this week we’re looking at three companies heading into their reports with different trajectories. One is in a long-term downtrend, one has been a steady riser, and one is somewhere in between. Let’s unpack what’s happening adn what to watch, all with an eye on balancing opportunity and risk, something that matters even more when you’re ...
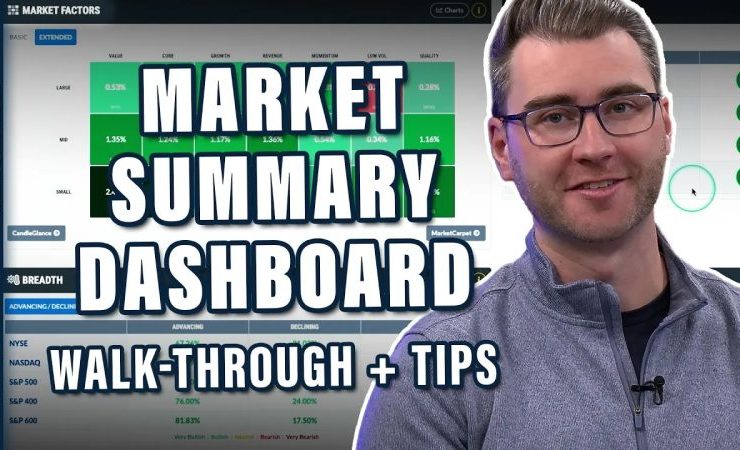
In this in-depth walkthrough, Grayson introduces the brand-new Market Summary Dashboard, an all-in-one resource designed to help you analyze the market with ease, speed, and depth. Follow along as Grayson shows how to take advantage of panels, mini-charts, and quick scroll menus to maximize your StockCharts experience. This video originally premiered on May 12, 2025. Click on the above image ...
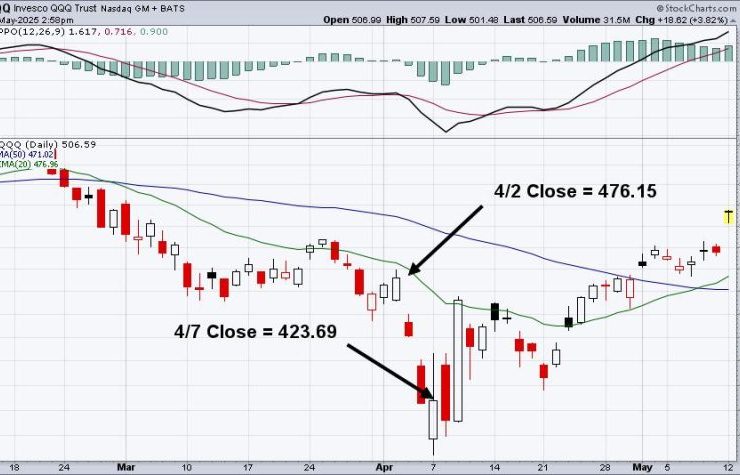
Let’s be honest. Did anyone think a little more than a month ago that the S&P 500 was primed for a 1000-point rebound? I turned bullish at that April 7th bottom a month ago, but I did not see this type of massive recovery so quickly. Why does this happen? I believe these panicked selloffs occur, because the big Wall ...