
Retail traders and investors often don’t get the credit they deserve. But in April, they showed they’ve got serious market smarts. While headlines screamed about a tanking stock market — remember, post-Liberation Day— retail investors waited patiently. And when the time felt right, they jumped in, adding $40 billion to the stock market during the month. Just this past Monday, ...

In this video, Frank dives into some of his favorite features on StockCharts.com. He then dissects the S&P 500 and Bitcoin price action, before exploring the the XLK Technology ETF’s explosive move off the lows. He also highlights a few recent trade ideas and setups worth watching. Get trade ideas and chart setups worth watching in today’s technical review. This ...
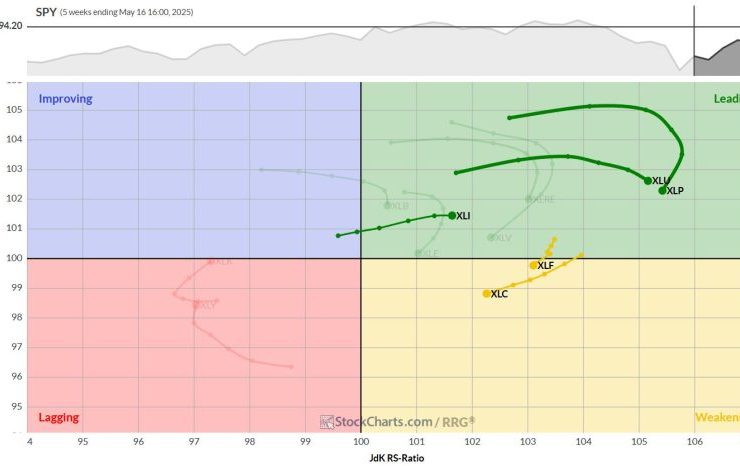
Sector Rotation Shakeup: Industrials Take the Lead Another week of significant movement in the sector landscape has reshaped the playing field. The Relative Rotation Graph (RRG) paints a picture of shifting dynamics, with some surprising developments in sector leadership. Let’s dive into the details and see what’s happening under the hood. (6) Industrials – (XLI)* (4) Financials – (XLF)* (1) ...

Earnings season continues with names like Home Depot, Palo Alto Networks, and BJ’s Wholesale flashing signals that investors shouldn’t ignore. Whether you’re following home improvement trends, cybersecurity growth, or retail resilience, these stocks offer insight into where the stock market could be headed next. Let’s break down the charts, decode the earnings, and explore the setups that could shape your ...
Learn how to analyze stock price gaps with Dave! In this video, Dave discusses the different types of price gaps, why all price gaps are not the same, and how you can use the StockCharts platform to identify key levels and signals to follow on charts where price gaps occur. Charts discussed include the S&P 500, First Solar (FSLR), Microsoft ...
For those of you who are a bit more steeped in technical analysis, you’ve likely heard of Dow Theory. A set of principles developed from Charles Dow, a journalist/analyst who founded what’s now the Wall Street Journal back in the late 19th century, Dow’s insight was foundational to modern technical analysis. Here’s a question: How can we view today’s market ...
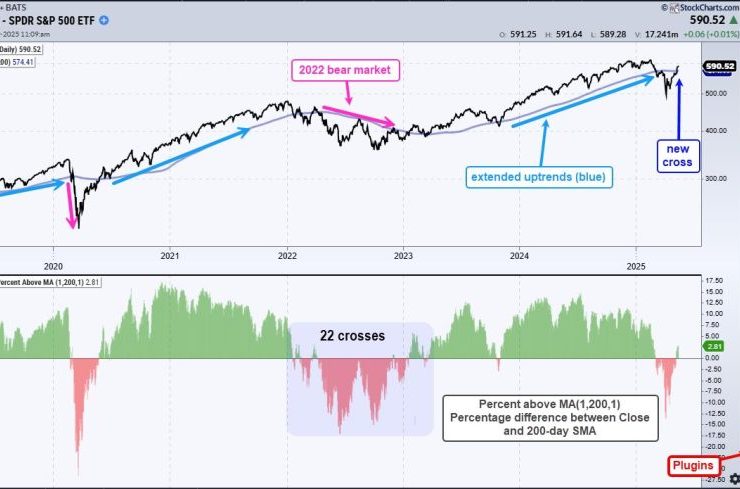
SPY and QQQ crossed above their 200-day SMAs with big moves on Monday, and held above these long-term moving averages the entire week. The V-Reversal was extraordinary and SPY seems short-term overbought, but this cross above the 200 day SMA cross is a bullish signal for the most important market benchmark. Despite a bullish signal, long-term moving averages are trend-following ...

If you didn’t check in on the stock market the last couple of weeks, you might be surprised to see how strong they were this week. The three major stock indexes — S&P 500 ($SPX), Nasdaq Composite ($COMPQ), and Dow Jones Industrial Average ($INDU) — broke through their 200-day simple moving averages (SMAs) and are about 3–5% away from their ...
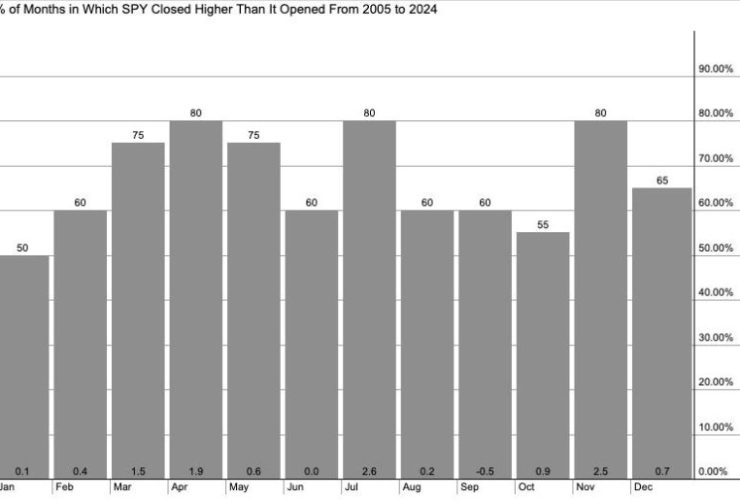
We’ve all heard the classic market maxim, “Sell in May and go away.” For many investors, that’s the introduction to market seasonality that suggests a six month period where it’s just best to avoid stocks altogether. Through my own experience, complemented with interviews with seasonality experts like ” We’ll dig deeper into the history of “Sell in May,” analyze summer ...

Looking for breakout stocks and top market leaders? Follow along Mary Ellen shares stock breakouts, analyst upgrades, and sector leadership trends to help you trade strong stocks in today’s market. In this week’s episode, Mary Ellen reveals the stocks leading the market higher and explains what’s fueling their strength. She highlights base breakouts, analyst upgrades, and leadership stocks gaining momentum. ...