Oil and Natural Gas: Natural Gas under pressure EMA 200
- During this morning’s Asian trading session, the oil price continued its sideways consolidation in the $70.00-$70.70 range
- The price of natural gas continued to move in the support zone on Friday, October 18
Oil chart analysis
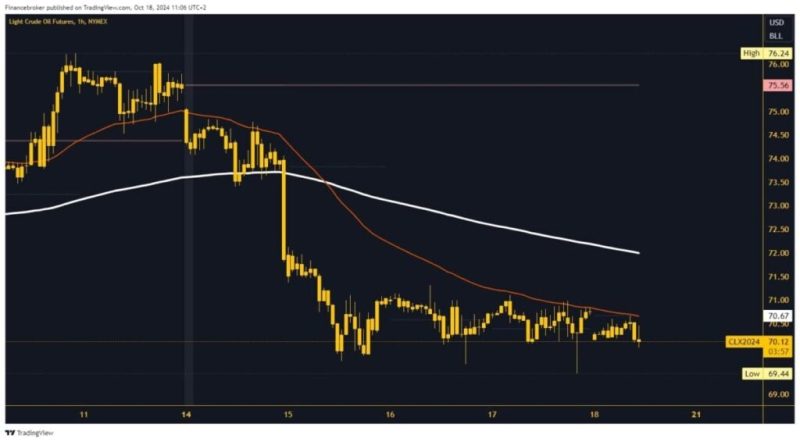
During this morning’s Asian trading session, the oil price continued its sideways consolidation in the $70.00-$70.70 range. The price continues to move in the support zone and below the EMA 50 moving average. Oil is still under pressure, which could produce a bearish impulse to a new daily low. This means a price drop below the $70.00 level again. Potential lower targets are $69.50 and $69.00 levels.
If we manage to reach $71.00, with that step, we get the support of the EMA 50 moving average to continue to the bullish side. We expect to see further oil advance with stronger bullish momentum to a new daily high. Potential higher targets are $71.50 and $72.00 levels. EMA 200 moving average could be a big problem in the $72.00 zone.
Natural gas chart analysis
The price of natural gas continued to move in the support zone on Friday, October 18. We are very close to breaking below the weekly low of $2.68. Rising price pressure could trigger a bearish impulse and thus form a new lower low. Potential lower targets are $2.65 and $2.60.
For a bullish option, the price of natural gas would have to first return above the $2.70 level. After seeing that, we expect a bullish impulse above the $2.72 level. There, we get the support of the EMA 200 moving average, which should further strengthen the bullish momentum for the continuation of the recovery. Potential higher targets are $2.75 and $2.80 levels. The EMA 50 moving average could represent resistance in the zone of the $2.80 level.

The post Oil and Natural Gas: Natural Gas under pressure EMA 200 appeared first on FinanceBrokerage.